Debug a chain step by step
A plain Run fires every node the instant it's ready and doesn't stop until the chain finishes or something fails. When you need to inspect a request before it goes out, or watch a specific branch settle before letting the rest continue, use breakpoints and the Debug button instead.
Arm a breakpoint
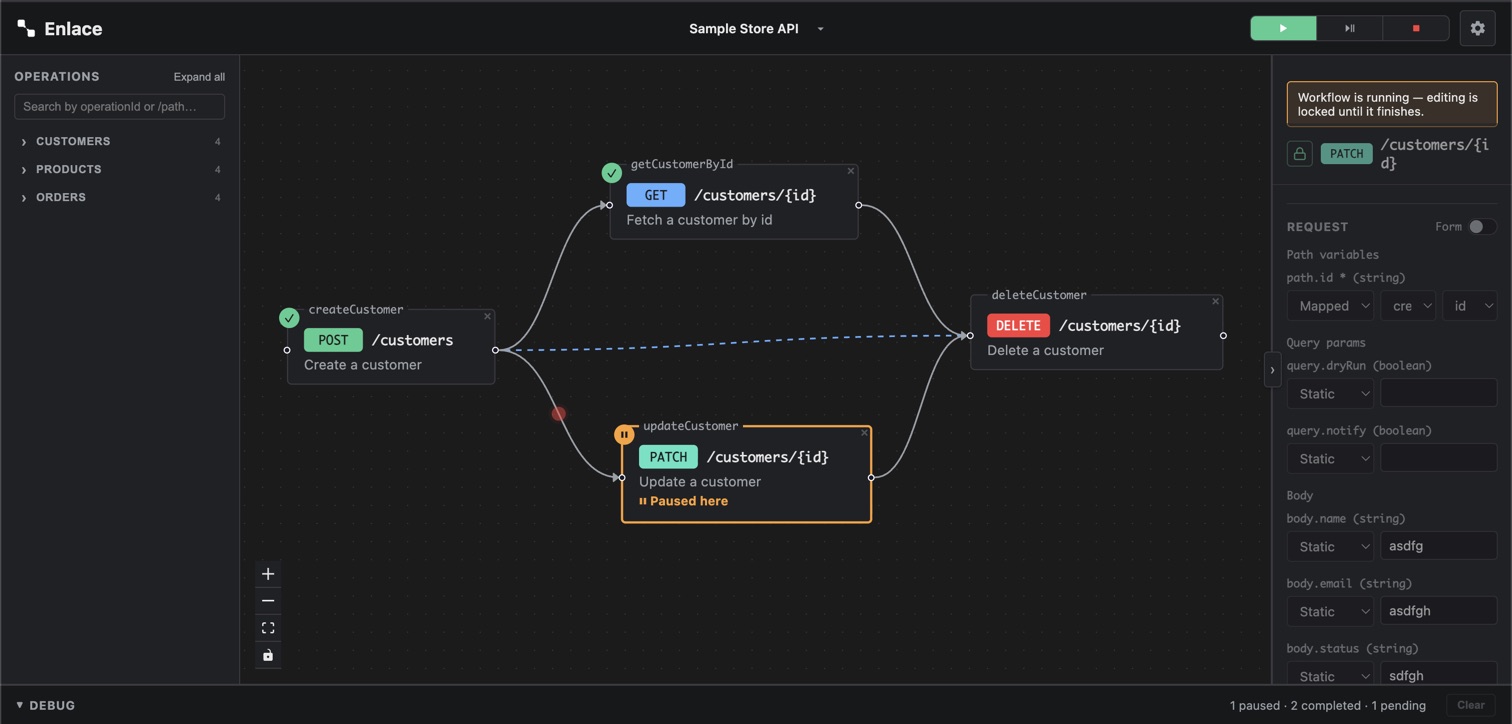
Double-click any connector (the solid arrow between two nodes). It grows a red dot at its midpoint — that connector is now armed. Double-click it again to disarm.
Breakpoints only arm on connectors, never on the dashed field-mapping edges — a double-click on a mapping edge does nothing.
Run with breakpoints
Run and Debug are separate buttons, and only one of them respects armed breakpoints:
- Run ignores every armed breakpoint outright. Handy for arming breakpoints ahead of time without forcing a stop-and-inspect run every time you hit Run.
- Debug honors them. Execution proceeds normally until it reaches a node sitting behind an armed connector — every dependency that node needs has already completed, but it pauses right there instead of firing.
A paused node's fully-resolved request — the same resolution a real fire would produce — is shown as a preview, marked "resolved, not yet sent," so you can check exactly what's about to go out before it does.
If a run left something unfinished, a small Debug failed icon shows up next to Debug too — same "skip what already succeeded" resume as Rerun failed, but honoring breakpoints for the rest, so you can pause right before the node that actually failed instead of re-running the whole chain to get there.
Continue, Step, and Stop
Once a run is paused, the header's Run/Debug buttons are replaced by Continue, Step, and Stop:
- Continue releases every node paused right now. If the chain hits another armed breakpoint further downstream, it pauses there too.
- Step releases just one paused node — either the one you have selected on the canvas, or the first paused node if none is selected.
- Stop admits nothing further. Every node still pending or paused at that point settles as skipped. Anything already in flight when you hit Stop can't be recalled, so it still runs to completion and reports its own result.
The Results pane's own header shows a matching "Paused at <node>" bar with its own Continue/Step, so you don't have to reach for the header controls mid-inspection. It targets whichever node is focused — the one you've clicked in the Results list or selected on the canvas, or the first paused node if you haven't picked one.
Independent branches still overlap
Pausing one branch never blocks another. If A → B is gated by a
breakpoint but A → C isn't, C fires as soon as A completes —
it doesn't wait for B to be released. A breakpoint gates exactly the
node(s) downstream of the connector it's armed on, nothing else.
Reading a debug run
The instant you hit Debug, every node gets a row in the Results pane, in
dependency order, so you can see the whole shape of the chain up front.
Each row's status updates live: pending → in flight → (paused, if it
hits a breakpoint) → completed/failed/skipped. Expand a row to see the
resolved request and, once it's actually fired, the response — the same
panel a plain Run's Results pane uses (see
Run a chain and read the results). Clicking a
row selects that node — on the canvas, and as the target for Step and
for the console's request/response shorthand below.
Inspect state with the Console
While a Debug session is active, the bottom pane splits into Results on the left and a Console on the right — a small REPL for querying the run's state directly instead of hunting through expanded rows.
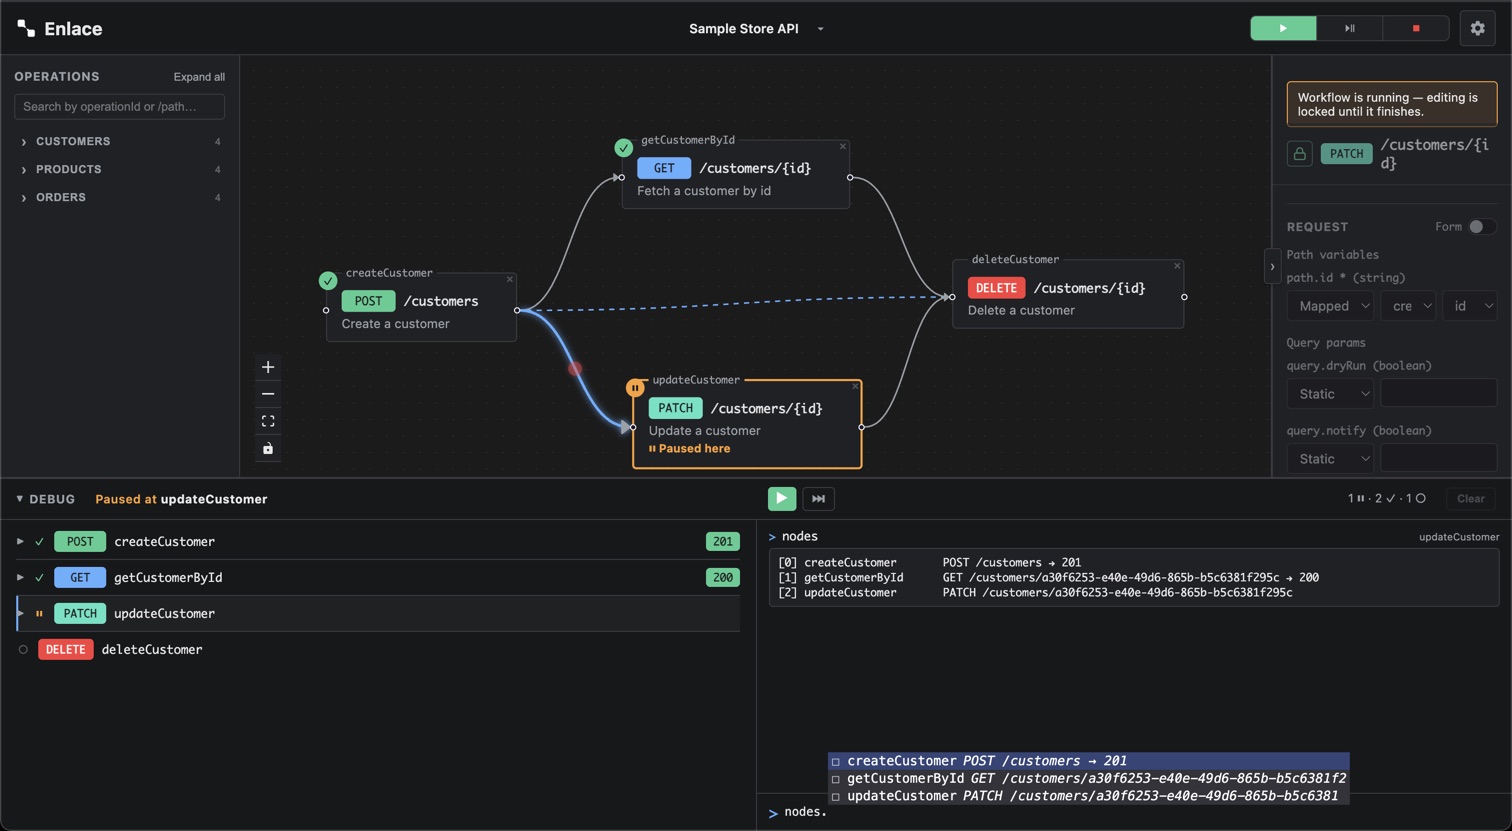
Everything hangs off one root, $:
$                     workflow: nodes, credentials, focus
$.nodes               nodes in run order
$.nodes.<label>       one node: request / response
$.nodes.<label>.request.params|query|headers|payload
$.nodes.<label>.response.status|headers|body
$.credentials         credential stubs (no secrets)
request / response    shorthand for the focused node
Type a path and hit Enter. Each result prints one level at a
time — $ prints its top-level keys with a short summary of each, not
a full recursive dump; a leaf like $.nodes.createOrder.response.status
prints that value directly. Drill down a segment at a time rather than
expecting one query to dump everything.
A few things worth knowing:
- Tab accepts the current autocomplete suggestion; Ctrl+Space opens it manually. ↑/↓ recall previous commands (when no suggestion popup is open).
requestandresponseare shorthand for whichever node is currently focused — the same focus the pause bar's Step button targets.clear/clswipe the screen without losing your↑/↓history.helpreprints the symbol/macro reference above.- Secrets are redacted the same way they are everywhere else in
Enlace — a credential's
Authorizationheader value never shows up here in the clear. - The console is session-only. It opens automatically when a Debug run starts and closes when that run ends — nothing about it is saved.
Clearing up
Breakpoints stay armed across runs until you disarm them or delete the connector they're on. Deleting a node or connection removes any breakpoint that was on it, same as connections and mappings referencing a deleted node.
The canvas locks against edits — field values, credentials, connections, armed breakpoints — for as long as a run is paused, not just while it's actively firing requests. Node position is the one exception: you can still drag nodes around a paused canvas. Hit Stop (or let it run to completion) to unlock it again.